06. PPG Sensor
heading
Photoplethysmogram (PPG) Sensor
ND320 C4 L2 05 PPG Sensor
PPG Sensor recap
Summary
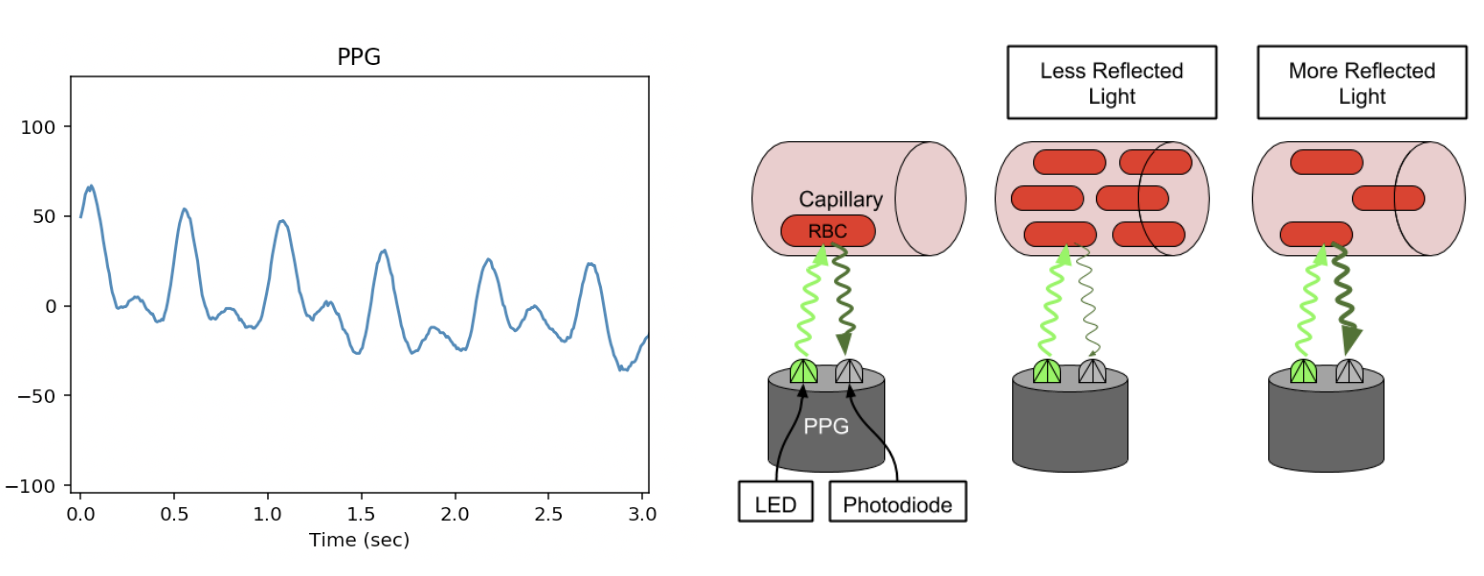
The photoplethysmogram (PPG) optically measures blood flow at the wrist. The LEDs in a PPG sensor shine a typically green light into your skin and your red blood cells absorb that green light. The reflected light is then measured by the photodetector. When your heart beats and blood perfuses through the wrist, there are more red blood cells that absorb the green light and the photodetector sees a smaller signal. As the heart fills back up with blood and blood leaves your wrist, the more green light is reflected back and the photodetector reading goes up. This oscillating waveform can be used to detect pulse rate. See the illustration below.
PPG Sensor Diagram

PPG Sensor Diagram
ppg + melanin
The trough corresponds to a peak in perfusion and occurs when the ventricles of the heart contract, called systole. The peak in the waveform occurs when there is the least amount of blood in the wrist or when the heart relaxes and fills with blood, called diastole.
Noise Sources
There are many other factors that affect the signal.
Melanin
Skin absorbs light from the LEDs as well and darker skin absorbs more light. This causes a DC shift and a reduction in SNR in the PPG signal for people with darker skin.
Melanin

Effect of Melanin
arm motion
Arm Motion
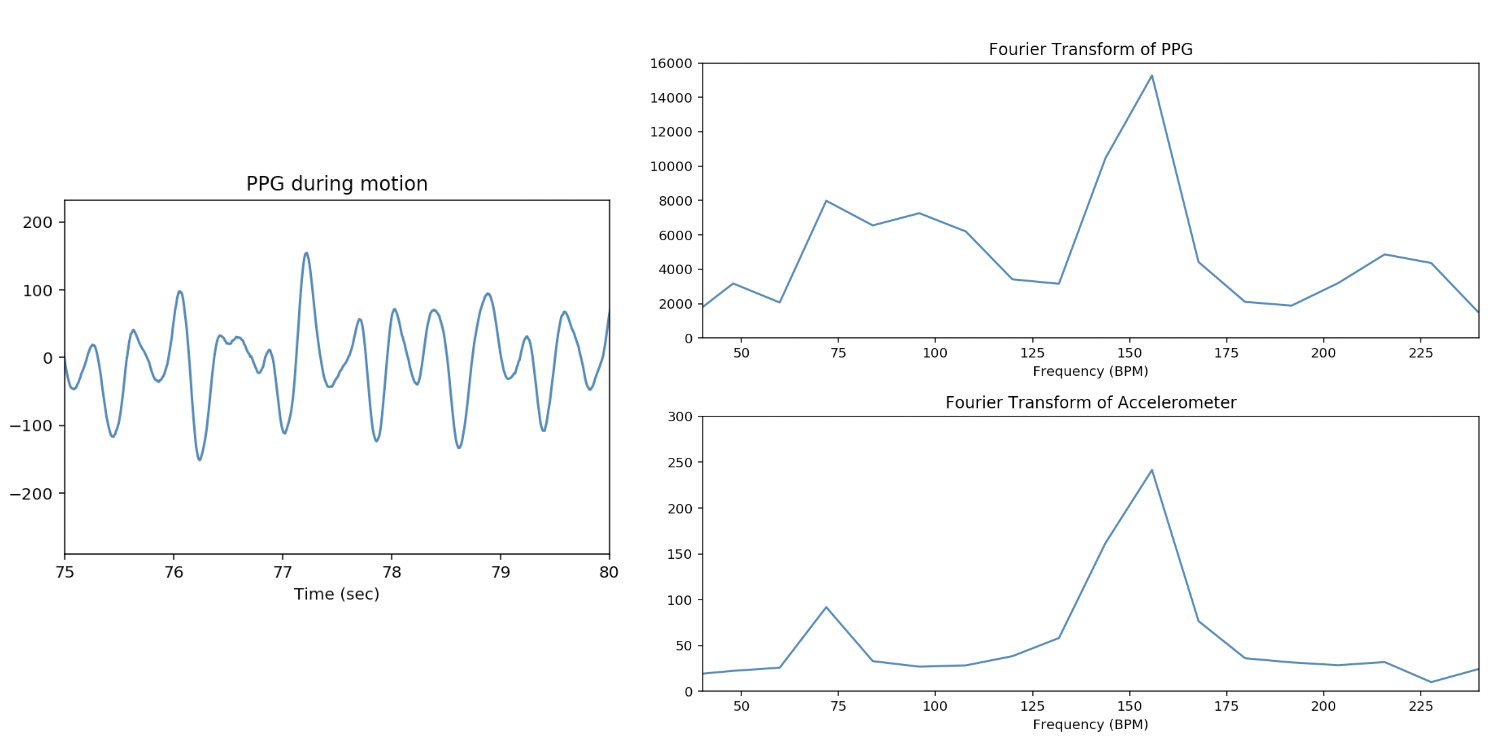
Blood is a liquid and when you move your arm around, the blood inside moves as well. This is what the PPG signal looks like while running. You can see the cadence of the arm swing in the FFT of the PPG signal as well as in the accelerometer.
Arm Motion

Effect of Arm Motion
arm position
Arm Position
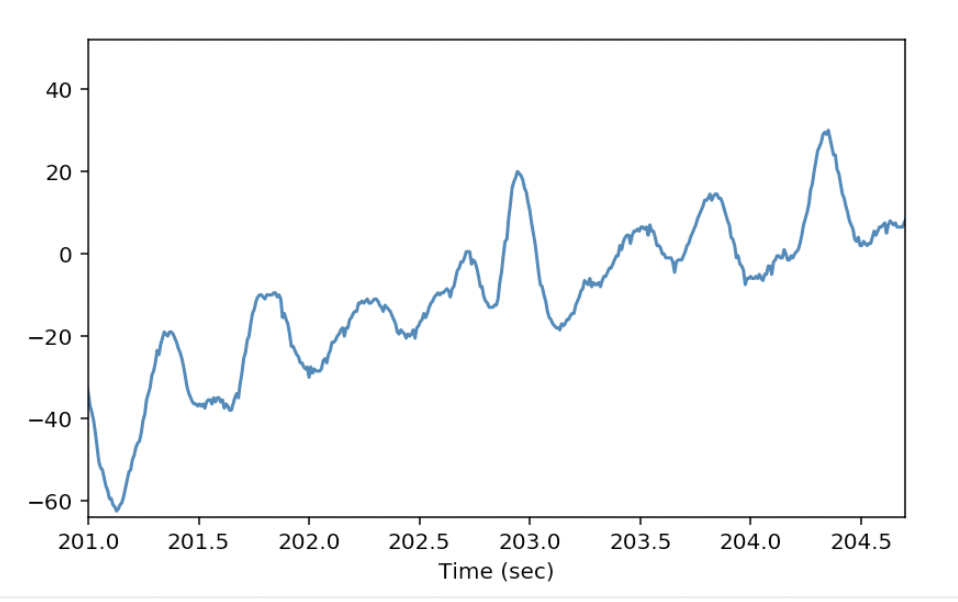
Even while at rest, if the position of the arm changes, blood flows into or out of the wrist. If you hang your arm down, more blood will flow into it and the DC level of the signal will slowly drop. If you raise your arm up, blood will flow out of your arm and the DC level will increase.
posture

Effect of Posture Change
finger mvt
Finger Movement
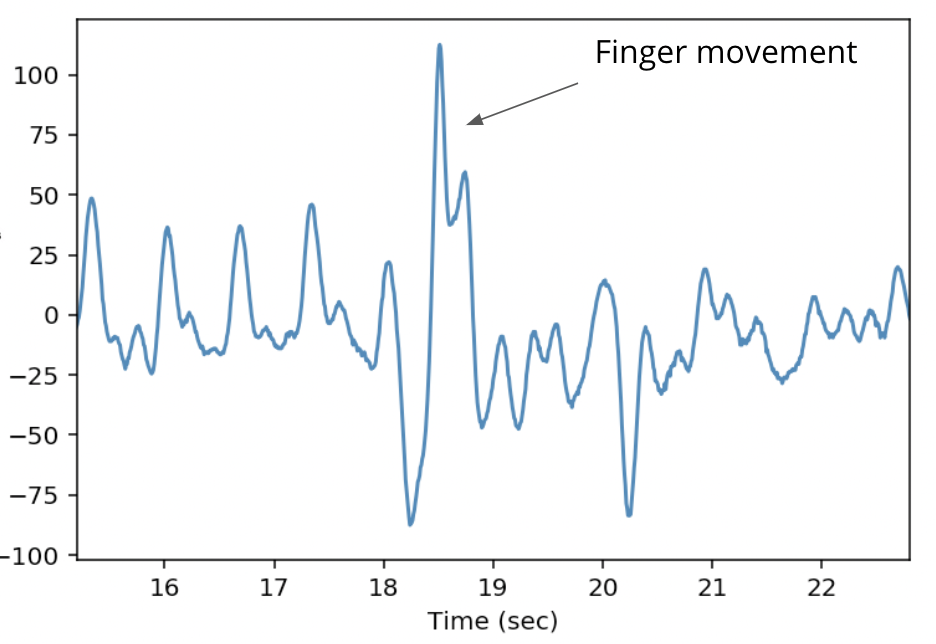
Moving your fingers around will cause a significant disturbance in the PPG signal because, as the tendons in your wrist move, they cause other structures to move around and may even shift the position of the sensor. All this motion will change the path that light takes to travel through the wrist and change the photodetector reading.
finger mvt

Effect of Finger Movement
recap
All these sources of noise make the PPG signal tricky to deal with, but now that you are aware of them, you can design algorithms that are robust to these events.
QUIZ QUESTION::
What does each part of the PPG wave correspond to in a cardiac cycle?
ANSWER CHOICES:
|
Part of a PPG |
Cardiac Cycle |
|---|---|
Peak |
|
Trough |
SOLUTION:
|
Part of a PPG |
Cardiac Cycle |
|---|---|
|
Peak |
|
|
Trough |
heading
New Vocabulary
- Photoplethysmogram (PPG): the optical sensor used to measure pulse rate on a wearable device.
- Photodetector: A sensor that measures light.
- Diastole: The phase of the cardiac cycle where the heart relaxes and fills with blood.
- Systole: The phase of the cardiac cycle where the ventricles contract and pump blood through the arteries.
Exercise 2: PPG Peaks
Instructions
- Complete the Offline or Online instructions below.
- Read through the whole
.ipynb. - Complete all the code cells that contain
## Your Code Goes Here.
Offline
- In the repo which you can access here in the repo
/intro-to-sensors/exercises/2-ppg-peaks/you should find the following files:
2_ppg_peaks.ipynbexercise2.npzppg_peaks.png
- Open up the python notebook and associated files in your desired editor.
Note: Instructions can be found in Introduction to Wearable Data's Concept Developer Workflow for how to set up your local environment.
Online
- Go to the next concept and the
2_ppg_peaks.ipynbshould be open and the workspace should already contain the appropriateexercise2.npzfile. This one will also contain theppg_peaks.pngfile for the instructions in markdown.